Inventory Dashboard Overview
The Inventory Dashboard provides a real-time snapshot of key financial and operational activity across your organization. The dashboard is informational, with the exception of the Recent Activity list, where each entry can be opened to view its related catalog item.
Accessing the Dashboard
Log into the web application.
In the left-hand sidebar, open Inventory.
Select Dashboard.

Dashboard Filters
Use the filters at the top of the dashboard to control which information is displayed:
CAPEX / OPEX – View both, or filter by CAPEX only or OPEX only.
Area – Display results for all areas or a specific area.
Transaction Type – Filter by movement type.
Date Range – Select a custom reporting period (default is the last 30 days).

All KPIs and charts refresh based on your filter selections.
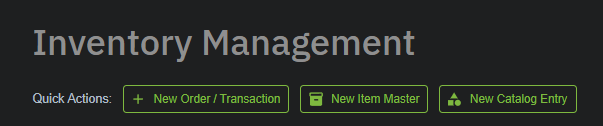
Quick Actions
Located at the top of the dashboard:
New Transaction – Start a new transaction (Immediate Record or Order Workflow).
New Item Master – Create a new master item template.
New Catalog Entry – Add a catalog item.
Financial KPIs
These tiles summarize financial activity for the selected time period:
Inventory Value – Total value of current inventory.
CAPEX % / OPEX % – Spend distribution between capital and operating expenditures.
Depreciation Value – Total depreciation across relevant items.

Operational KPIs
These tiles provide an overview of daily operational activity:
Transaction Count – Number of transactions recorded.
Total Quantity – Total quantity of items moved.
Unique Items – Number of distinct catalog items involved.
Value by Area – Total transaction value grouped by area.
Inventory Velocity – Frequency of item movement.
Pending Items – Number of items still requiring action.

Insights
Insights highlight areas needing review or attention:
Pending Approvals – Items awaiting approval.
Pending Corrections – Items flagged for correction.
Processing Completion – Percentage of fully processed transactions.
High Velocity Items – Most frequently moved or consumed items.

Additional Dashboard Panels
These panels offer additional detail and visibility:
GL Codes by Spend – Spend totals grouped by GL code.
Transactions by Area – Breakdown of transaction value by area.
Top AFEs by Value – AFEs with the highest value activity.
Items with Negative Stock – Items with stock levels below zero.
Low Stock Items – Items nearing minimum stock thresholds.
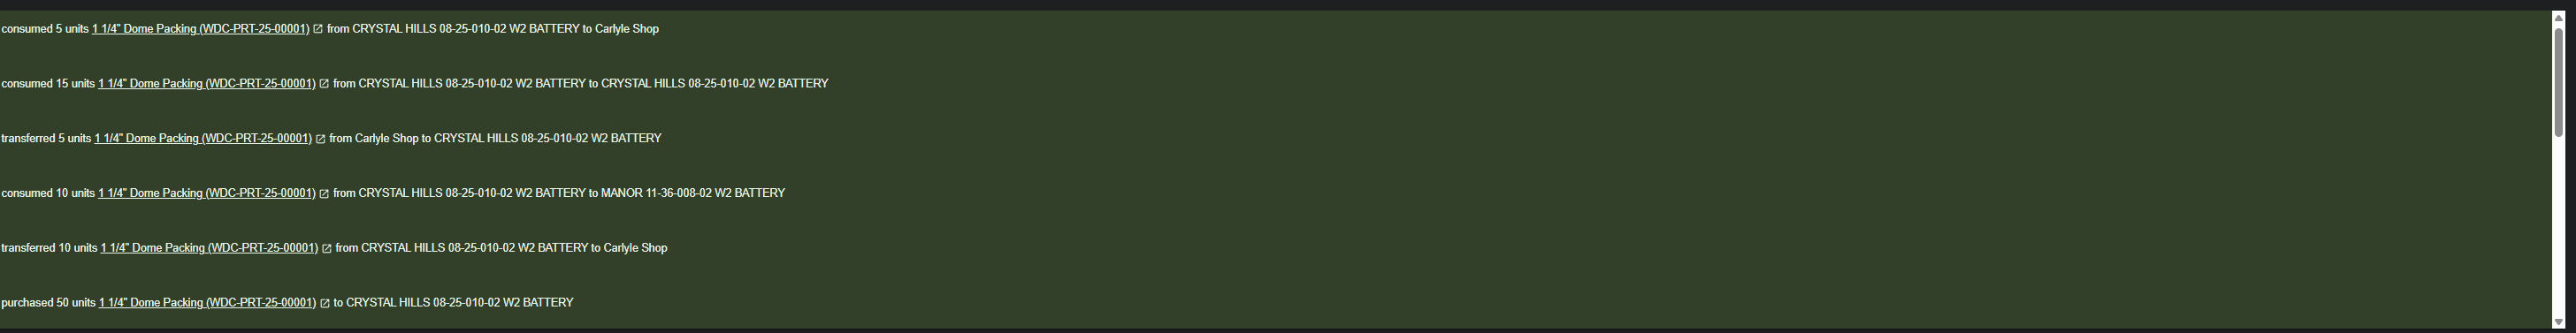
Recent Activity
Displays the most recent transactions recorded in the system.
Each entry is clickable and opens the related catalog item.
Was this article helpful?
That’s Great!
Thank you for your feedback
Sorry! We couldn't be helpful
Thank you for your feedback
Feedback sent
We appreciate your effort and will try to fix the article